Epic Trading: a private trading terminal watching nine exchanges at once
The most demanding thing we run in production. Epic Trading connects to nine crypto exchanges simultaneously, records every trade and every order-book change they publish, and paints it all live in the browser: who is buying, who is selling, where the large orders sit, and when they get pulled. It currently processes around ten million trades an hour, with far more order-book updates on top.
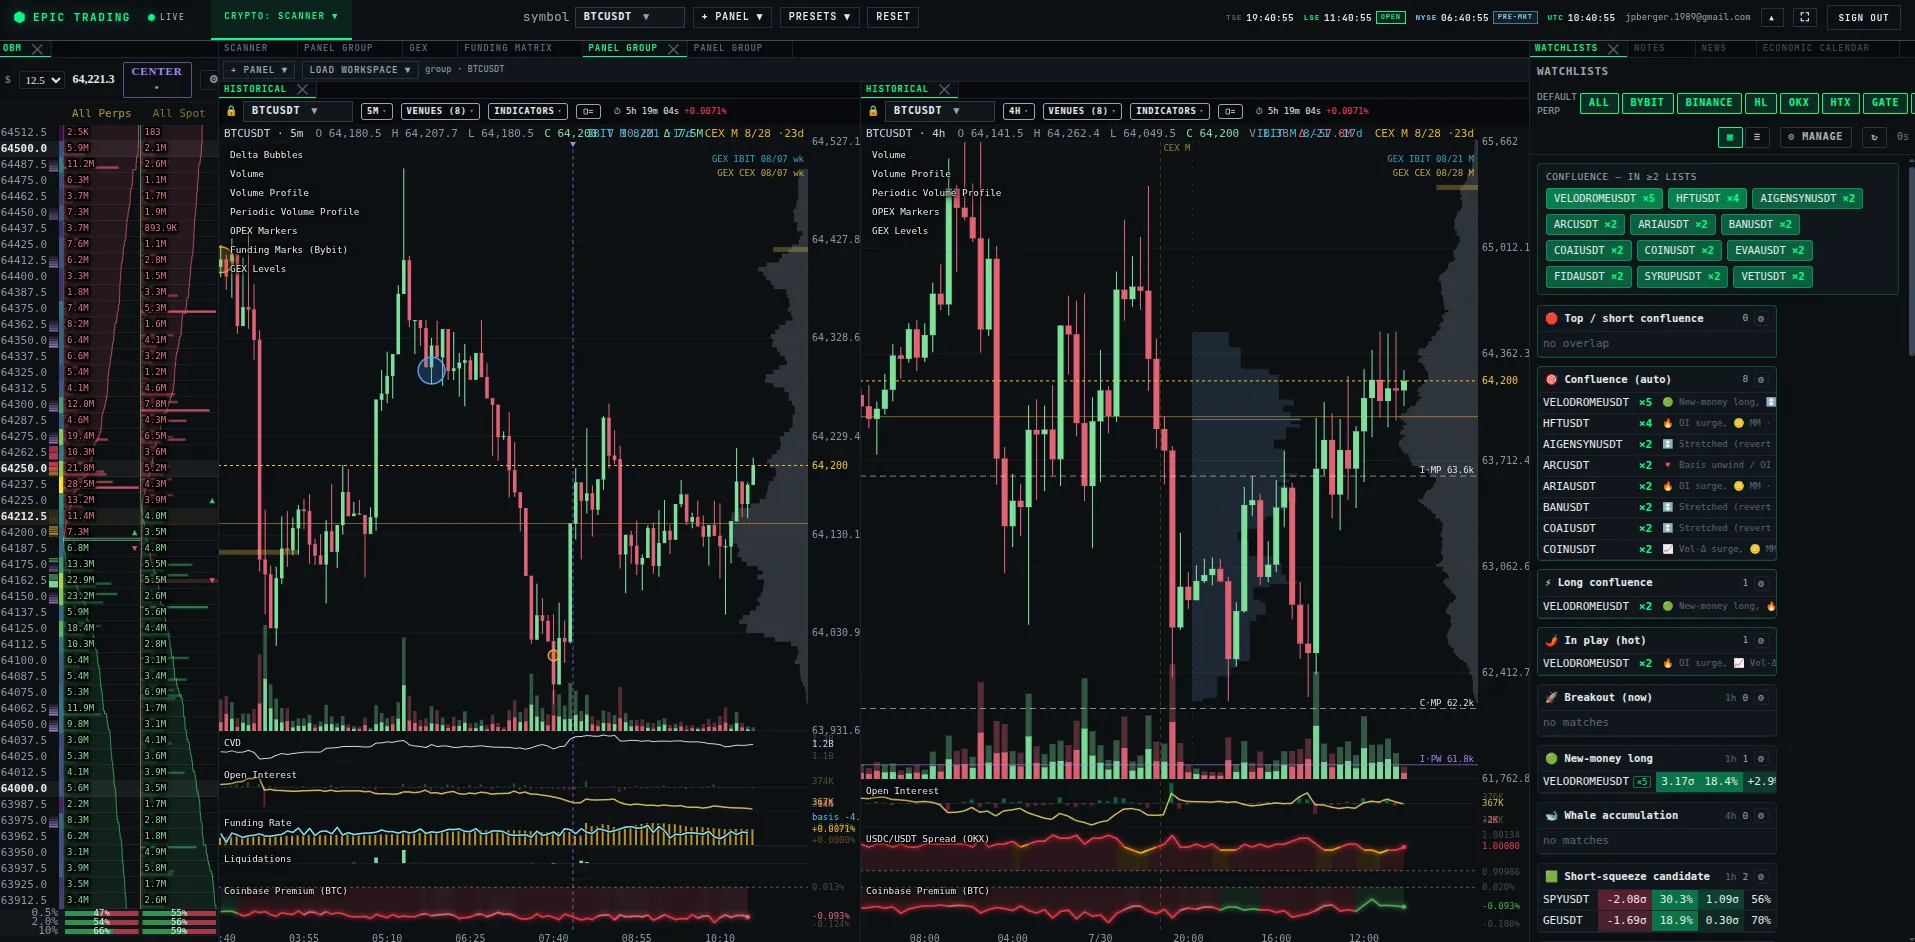
Every trade, live, from nine venues
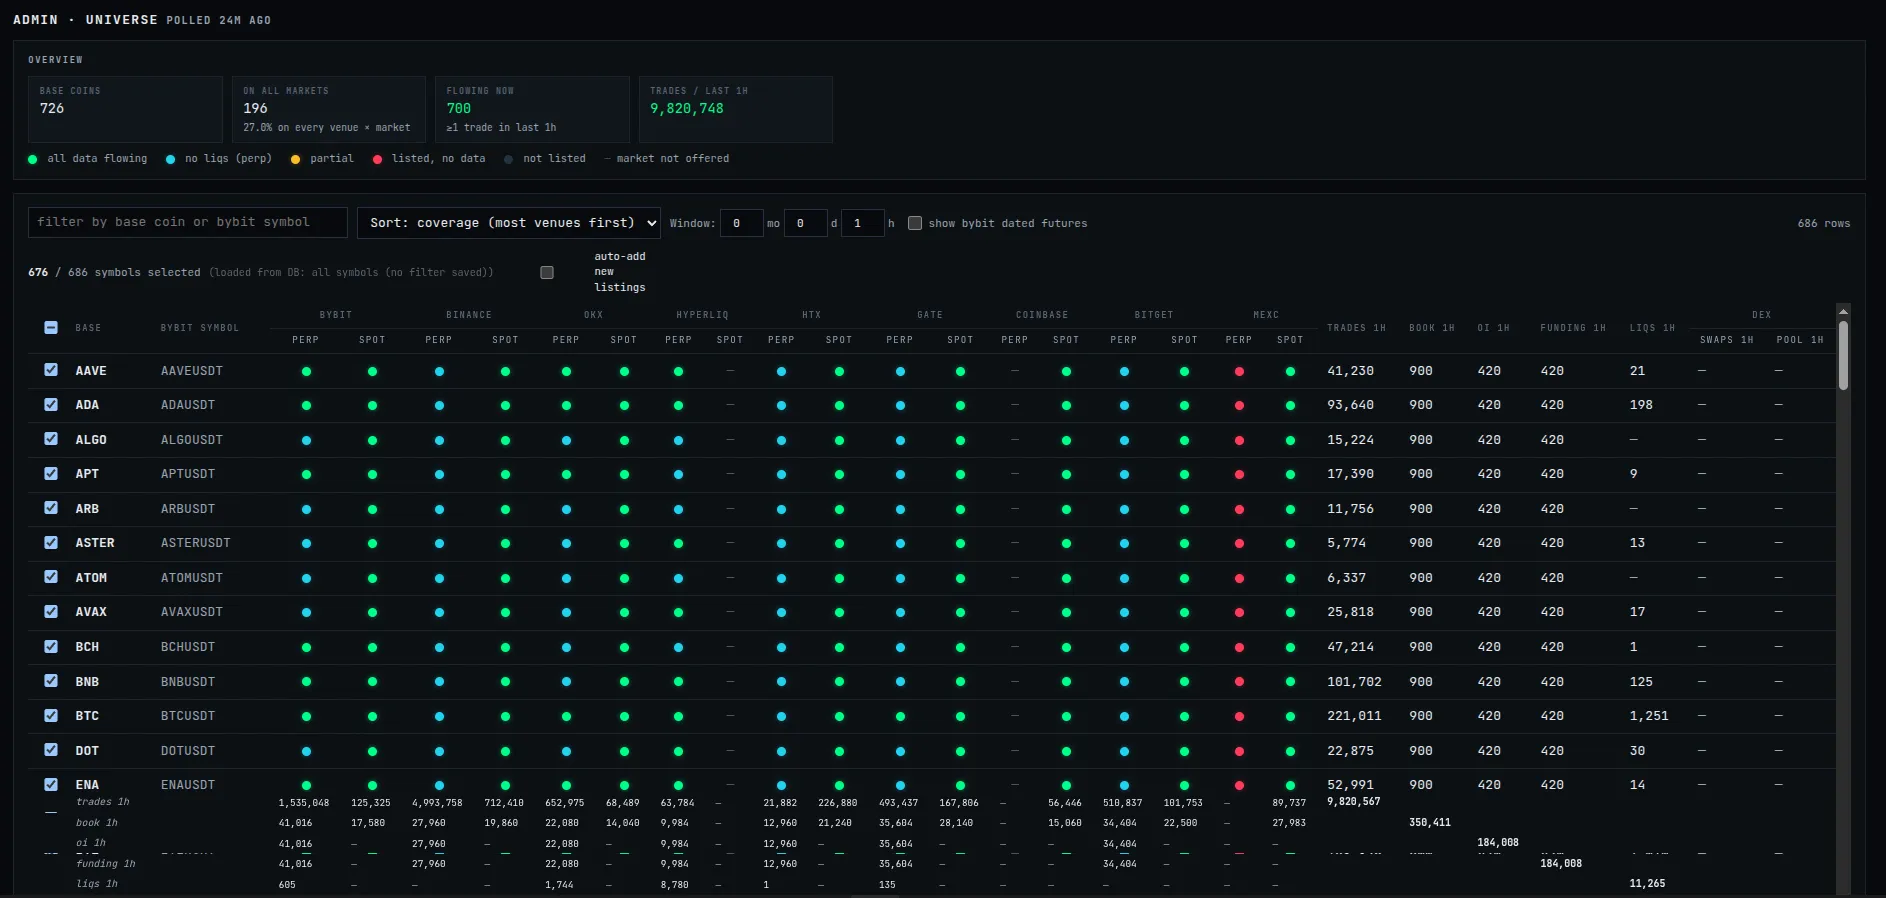
Nine exchanges, one screen
Binance, Bybit, OKX, Coinbase and five more, streamed into one dashboard instead of nine browser tabs. Every venue speaks a different protocol; the terminal makes them one language.
Built for bursts
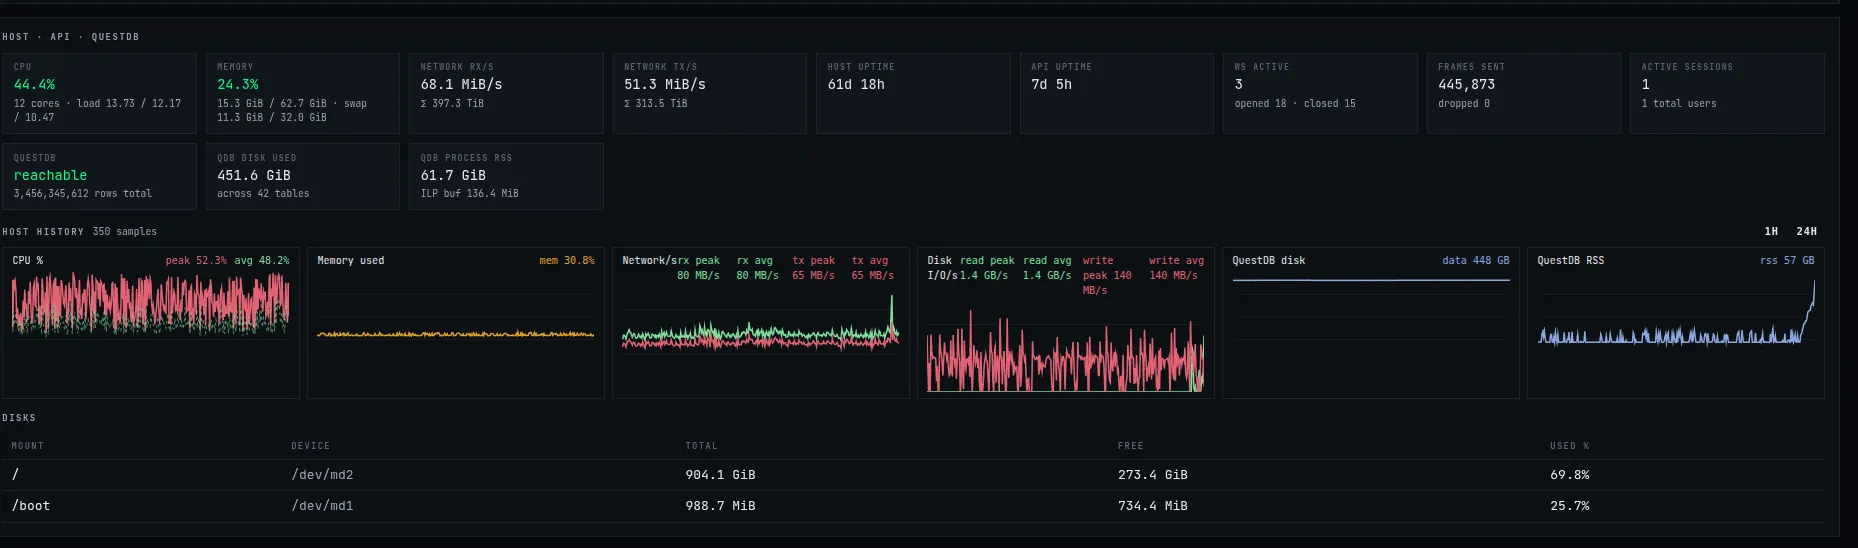
Markets idle for minutes, then explode. The pipeline was measured absorbing 22,876 trades in a single second, a genuine market-wide burst across all venues, while the server loafed at 11% CPU.
Audited against lost data
The fast display path is allowed to drop under pressure, so instead of assuming, we measured: on the majority of streams, the ground-truth count matched exactly. Zero missing trades.
Smooth under fire
A custom paint scheduler keeps 25 panels sharing one screen fairly: heavy panels slow themselves down, hidden panels cost nothing, and no panel can freeze out another.
Your workspace, your rules
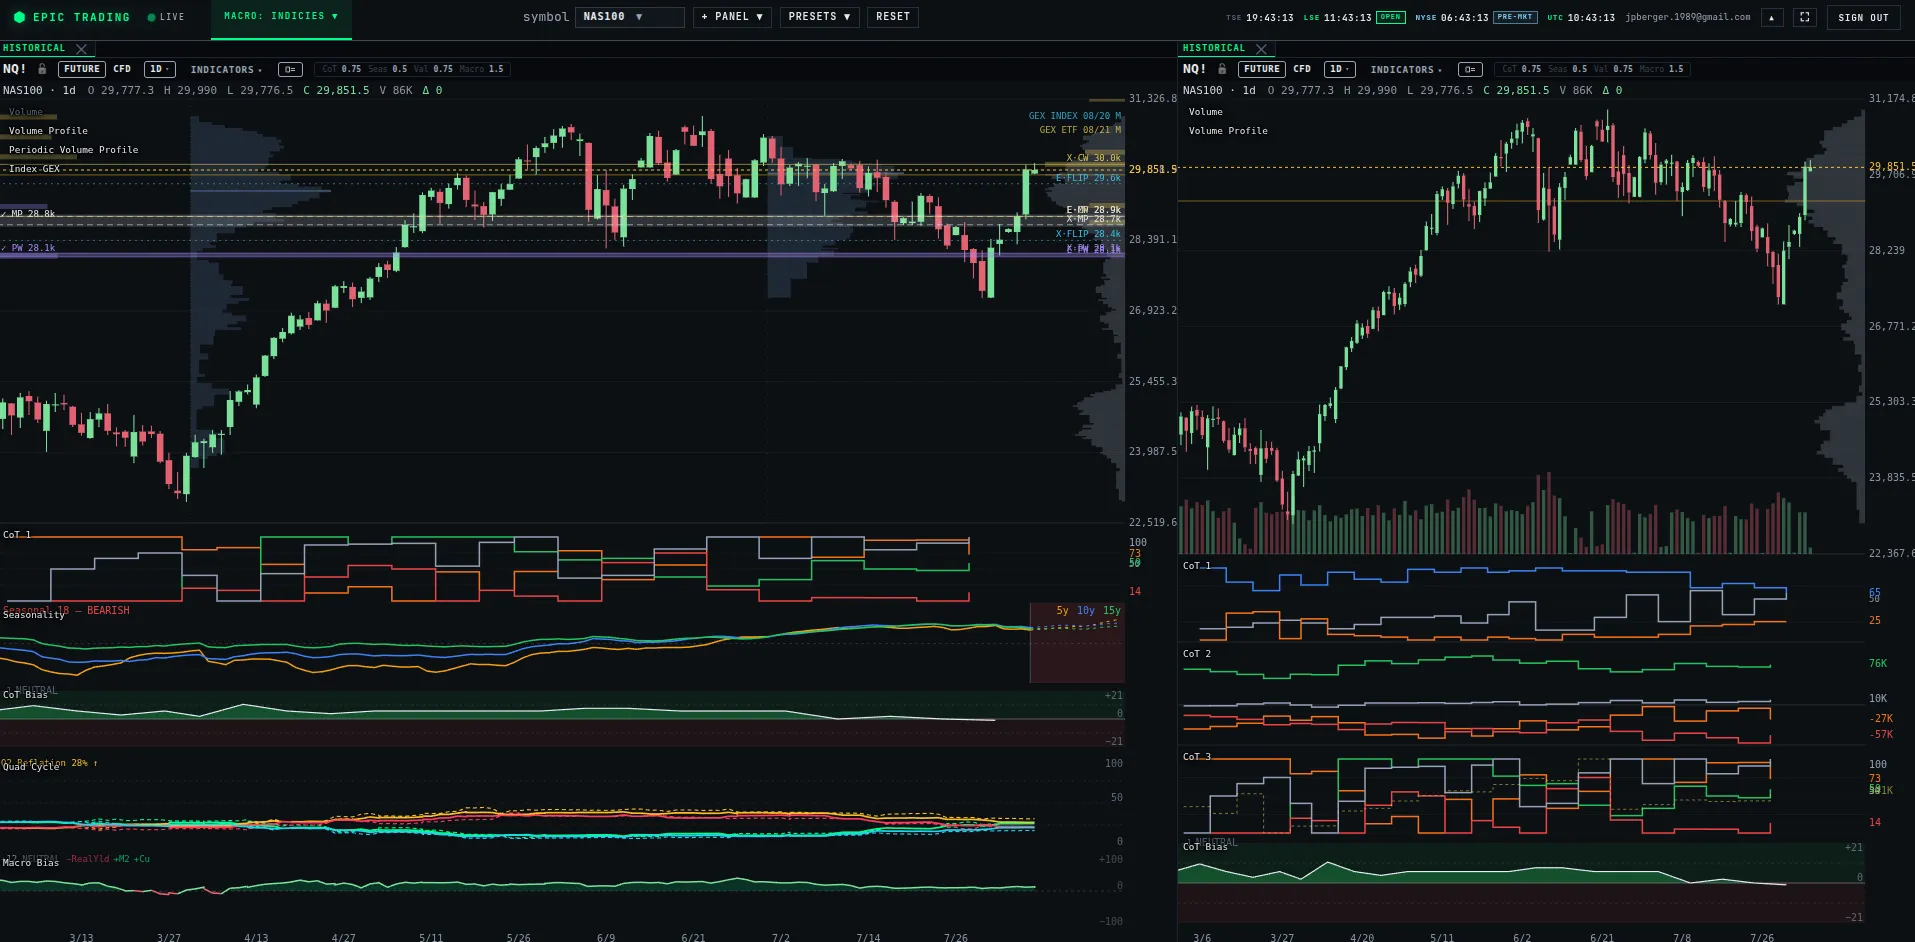
Dockable panels you drag, resize, group and save as presets. Every layout in these screenshots is just one arrangement among many.
Connections that heal themselves
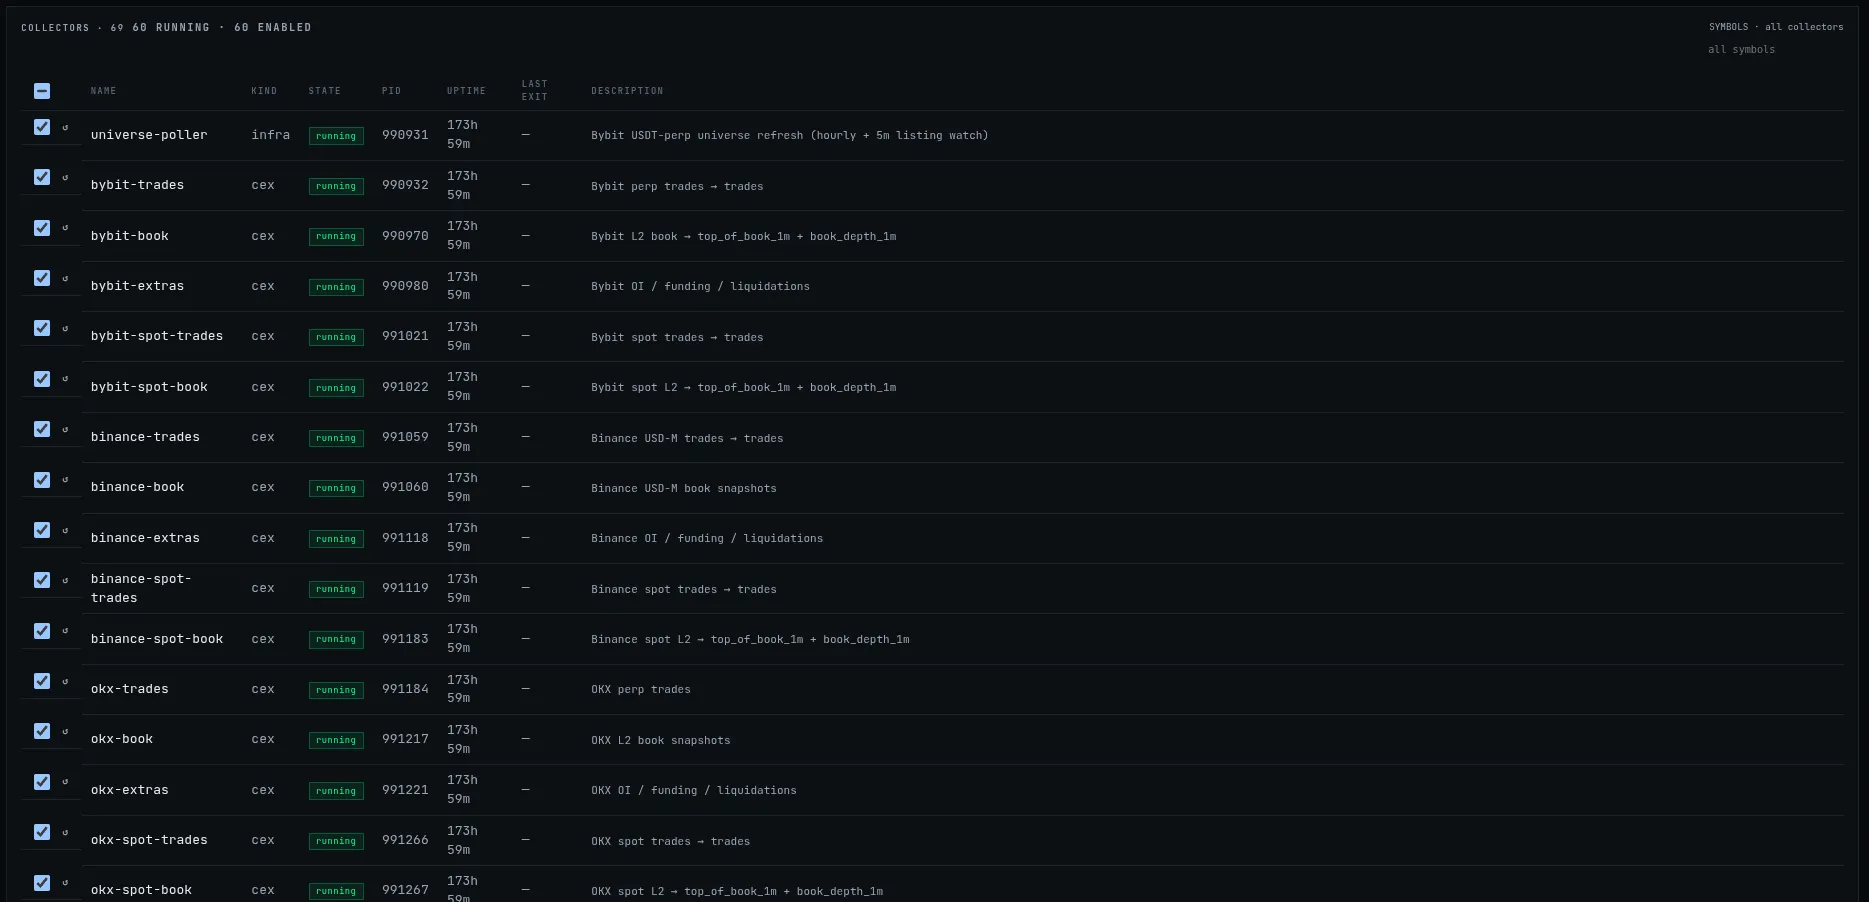
Exchanges disconnect constantly. Every socket reconnects with randomised backoff and a watchdog, so one server restart cannot stampede the whole system.
The macro picture too
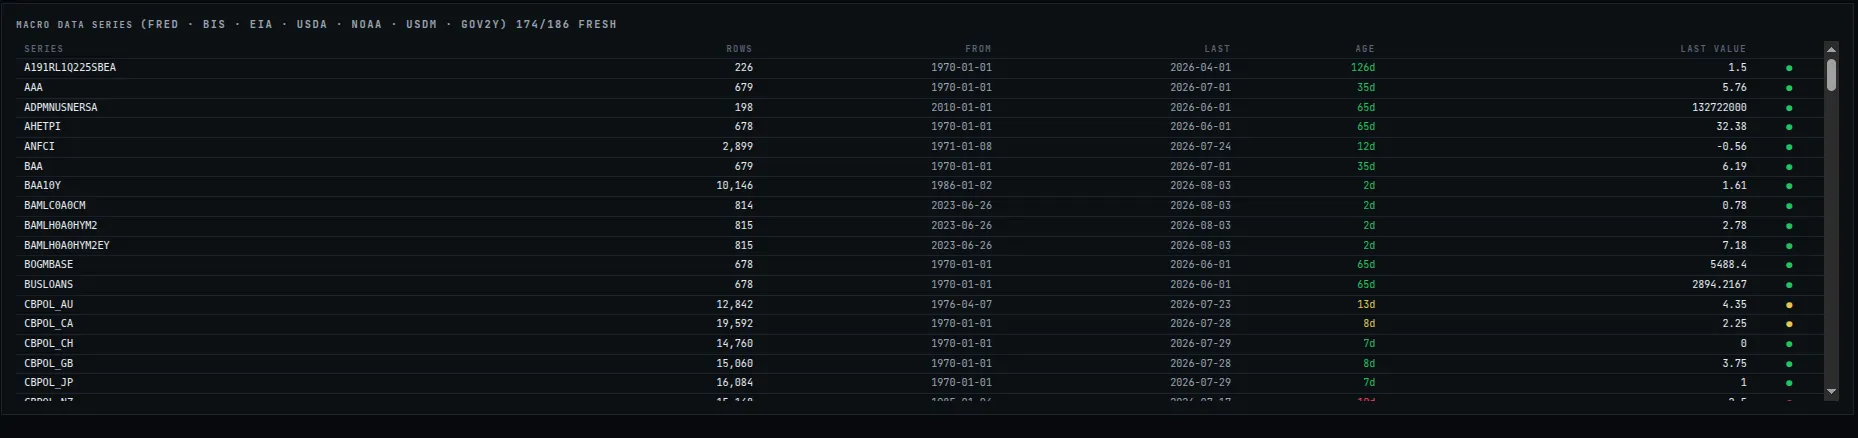
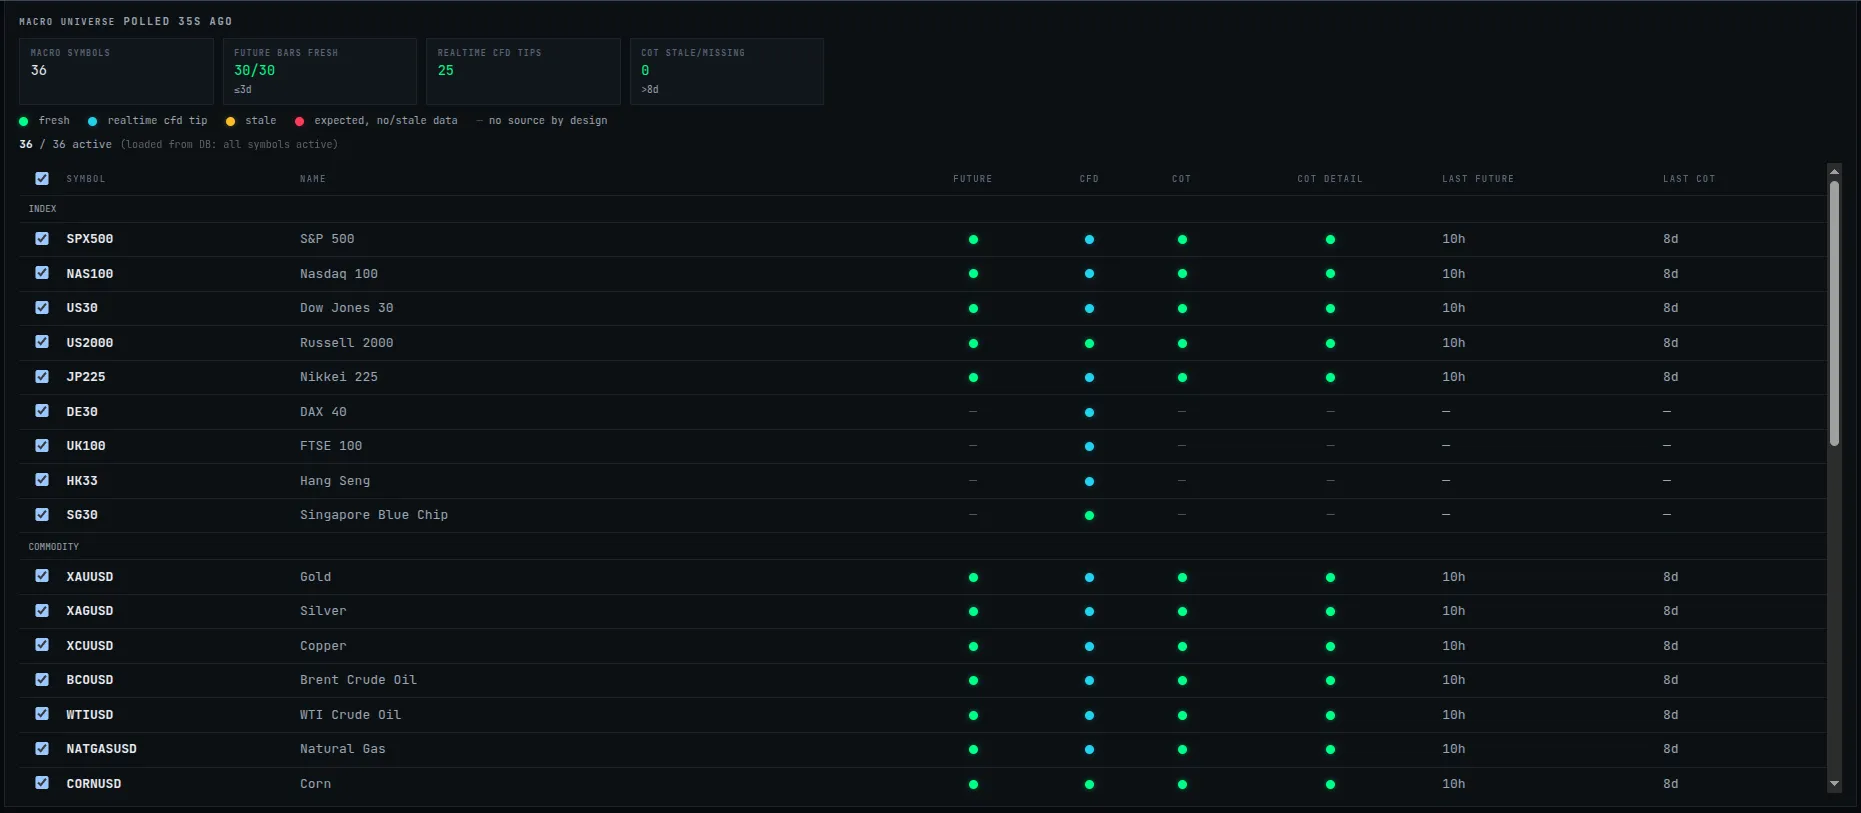
Beside the crypto flow: 186 economic data series from sources like FRED, BIS and EIA, futures positioning, seasonality and options-dealer levels, each tracked for freshness.
Heavy lifting off the main thread
Parsing and aggregation run in background workers with their own connections, so the interface stays responsive no matter what the market does.
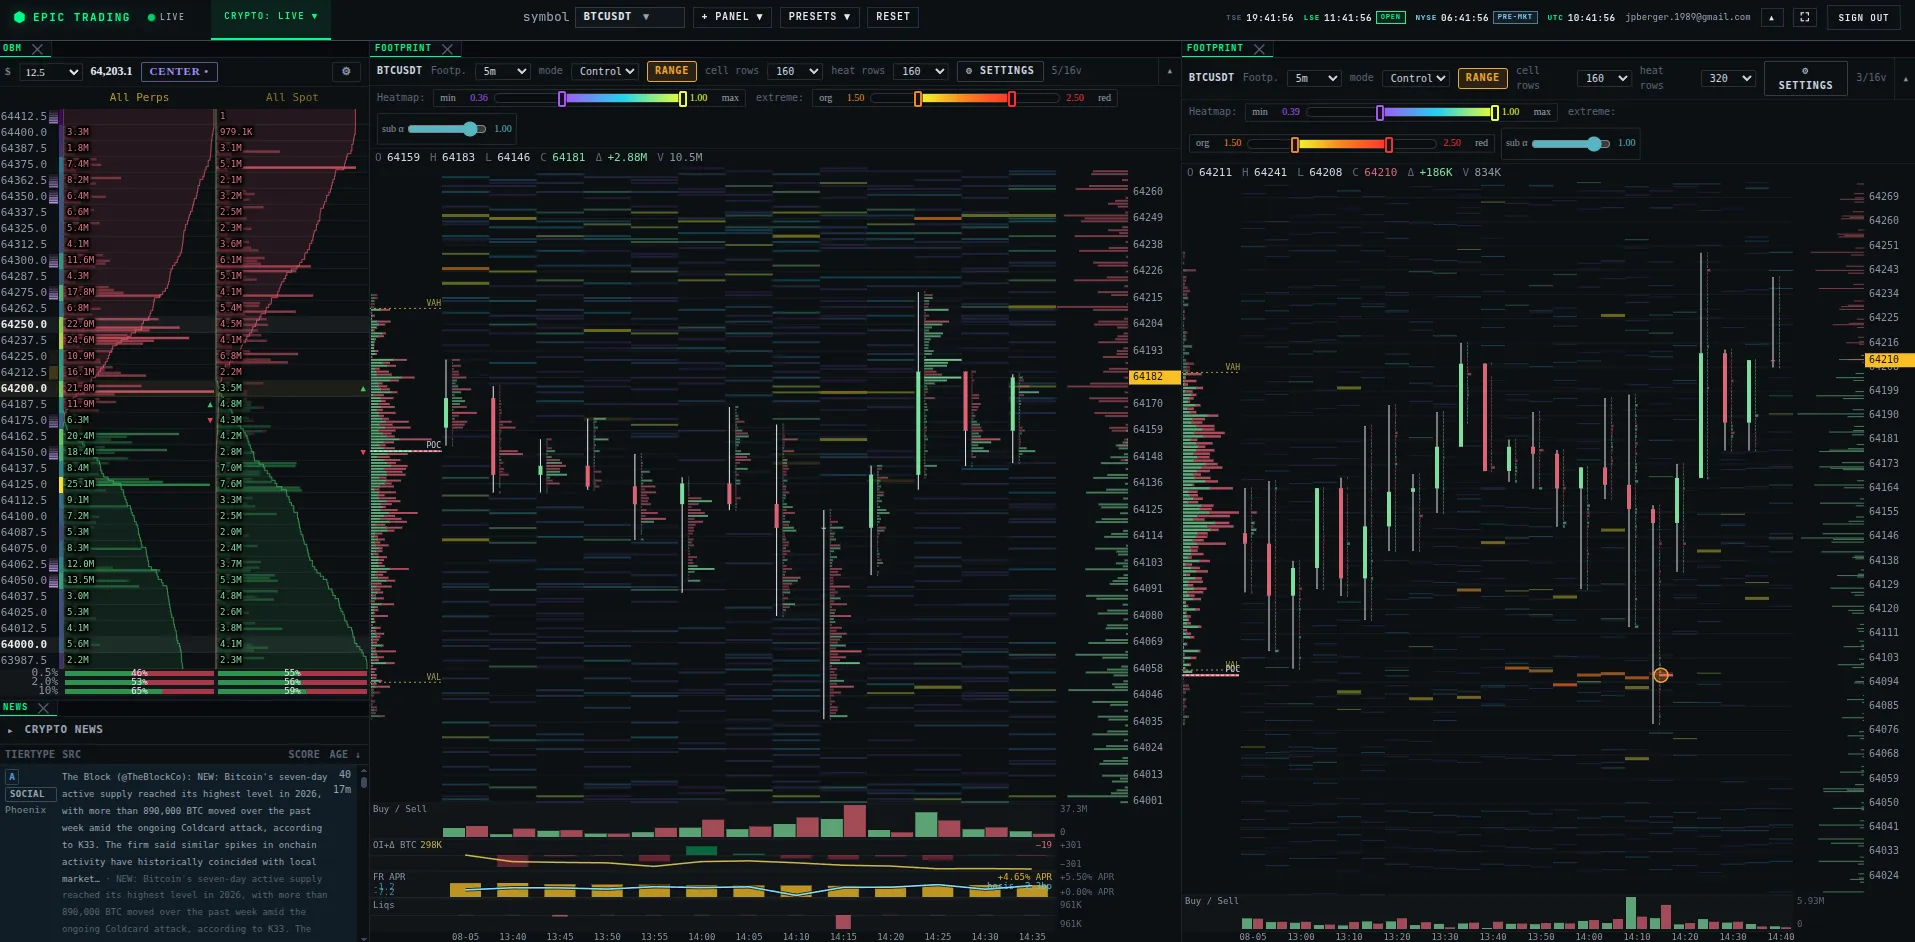
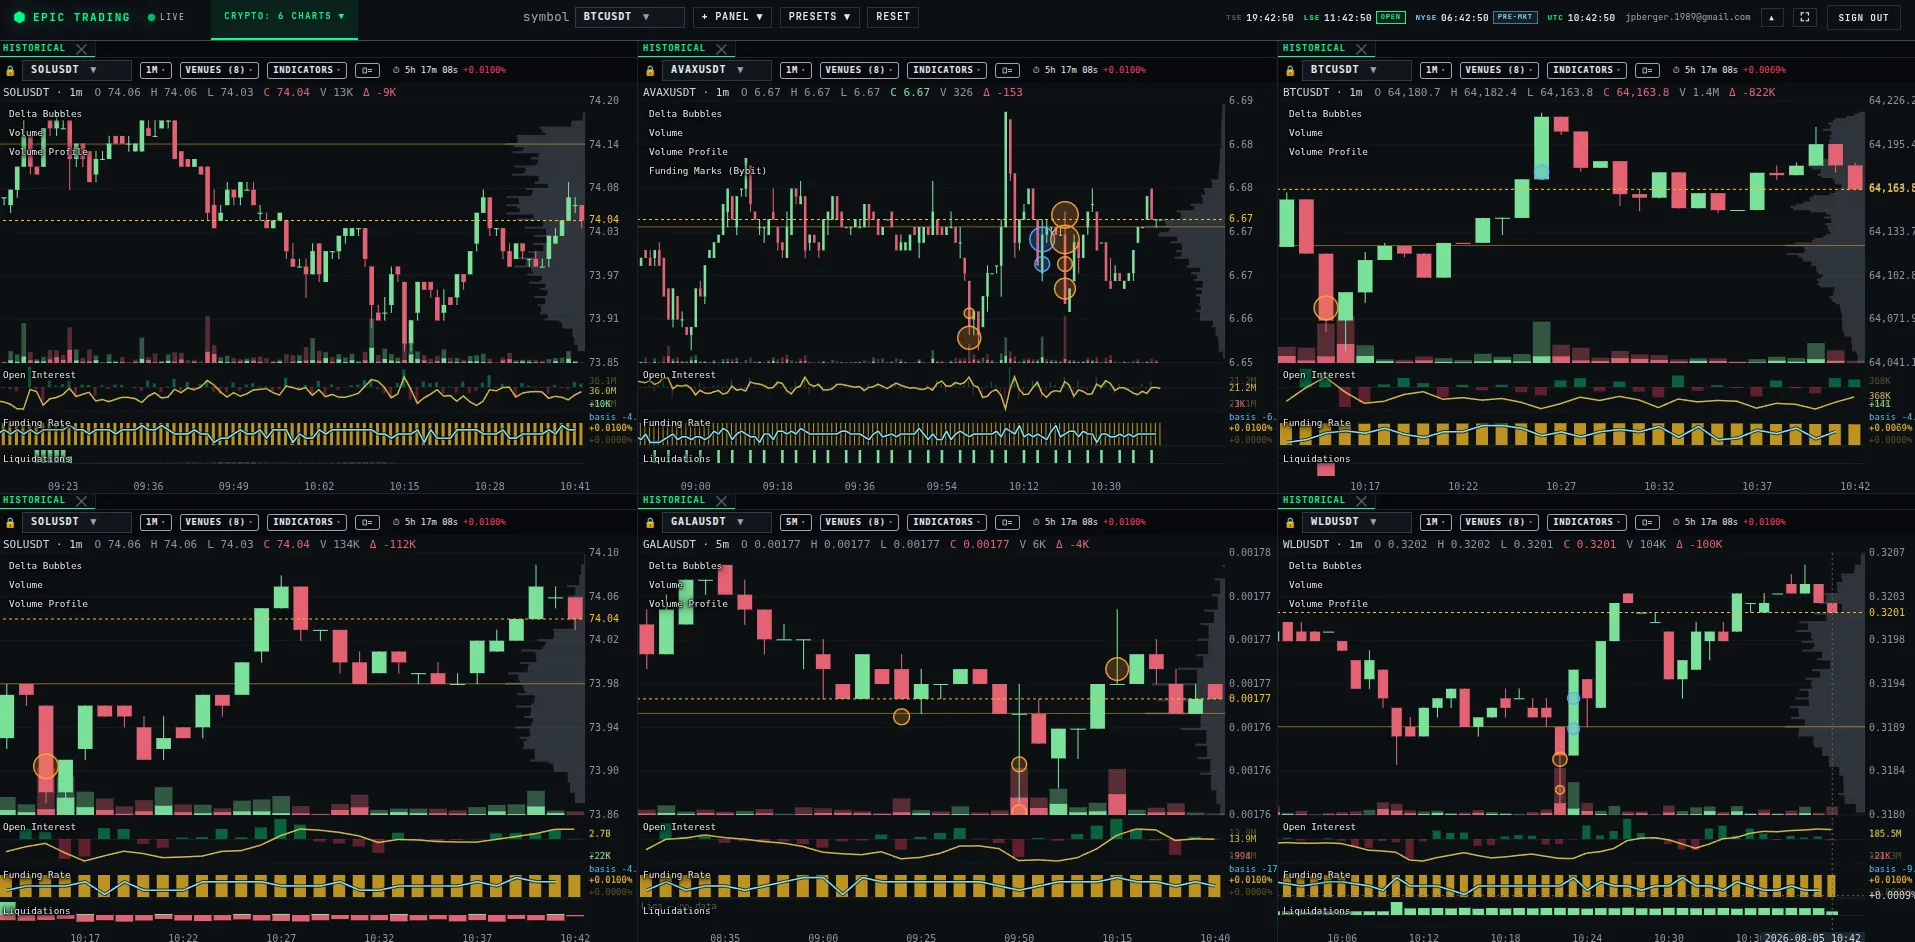
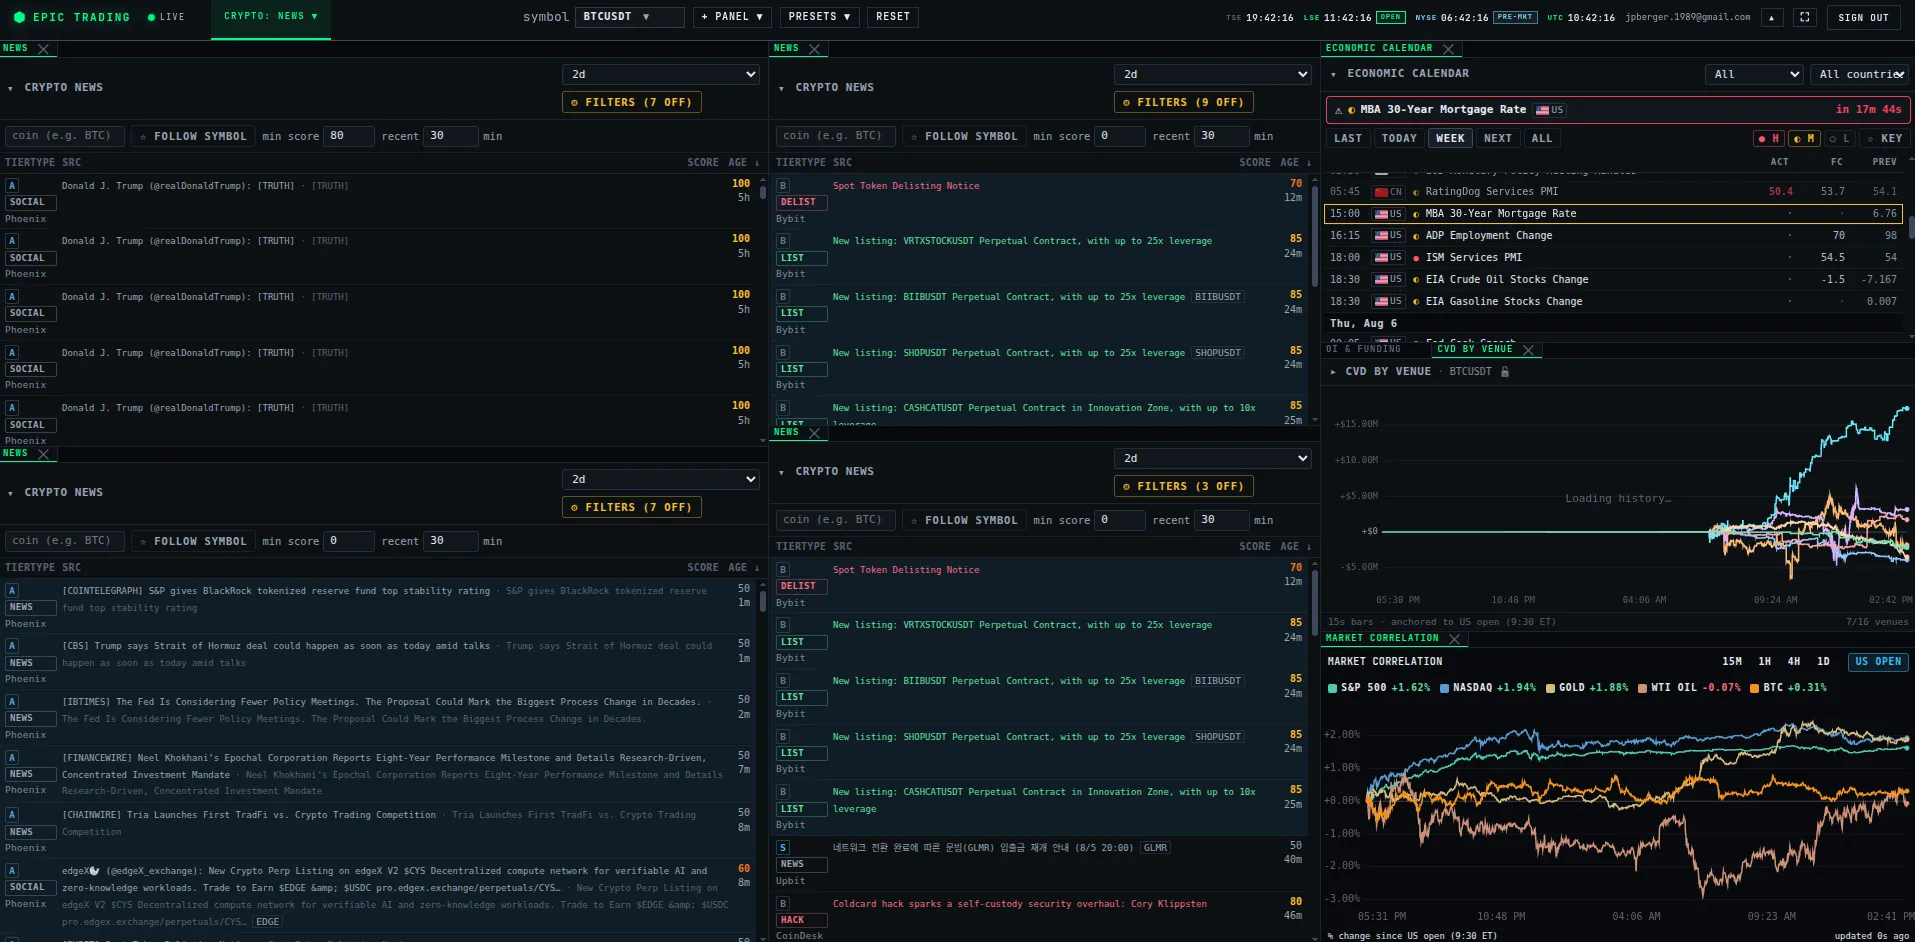
Stack: Rust collectors and API, QuestDB time-series storage (3.4 billion rows and counting), React 18 with canvas rendering and Web Workers.
The hardest end of the spectrum
Real-time market data is unforgiving: thousands of events a second, nine venues that each speak differently, and a screen that has to stay smooth through all of it. Here is what that took:
The firehose
When data can burst a hundredfold in one second, you cannot hope it will not. Buffers, backpressure and grace windows are designed in from the start.
The truth
Nine exchanges disagree about message formats, timestamps and book semantics. The system reconstructs one coherent picture, and its accuracy is measured, not assumed.
The screen
All that data is worthless if the interface stutters. Rendering is budgeted like any other scarce resource: rate caps, adaptive backoff, and fairness between panels.
The discipline
The project keeps a written audit of itself where every performance claim states how it was counted, and claims that could not be verified are marked as such.
Most business software will never face a fraction of this load. But the habits this kind of system demands, measuring instead of assuming, designing for failure, staying smooth under pressure, carry into everything we build.
Next case study: BizBuy →If this sounds like what you need, the next step is a call.
Thirty minutes on Google Meet. We go through your business and what you want to change, and you leave knowing whether it is worth building and roughly what it would take.
Free, and nothing to prepare. Pick a time that suits you.

- Phone / WhatsApp
- +971 58 502 0610
- [email protected]